Monitoring and Security
Monitoring (Grafana/Prometheus stack) and SSL certificates.
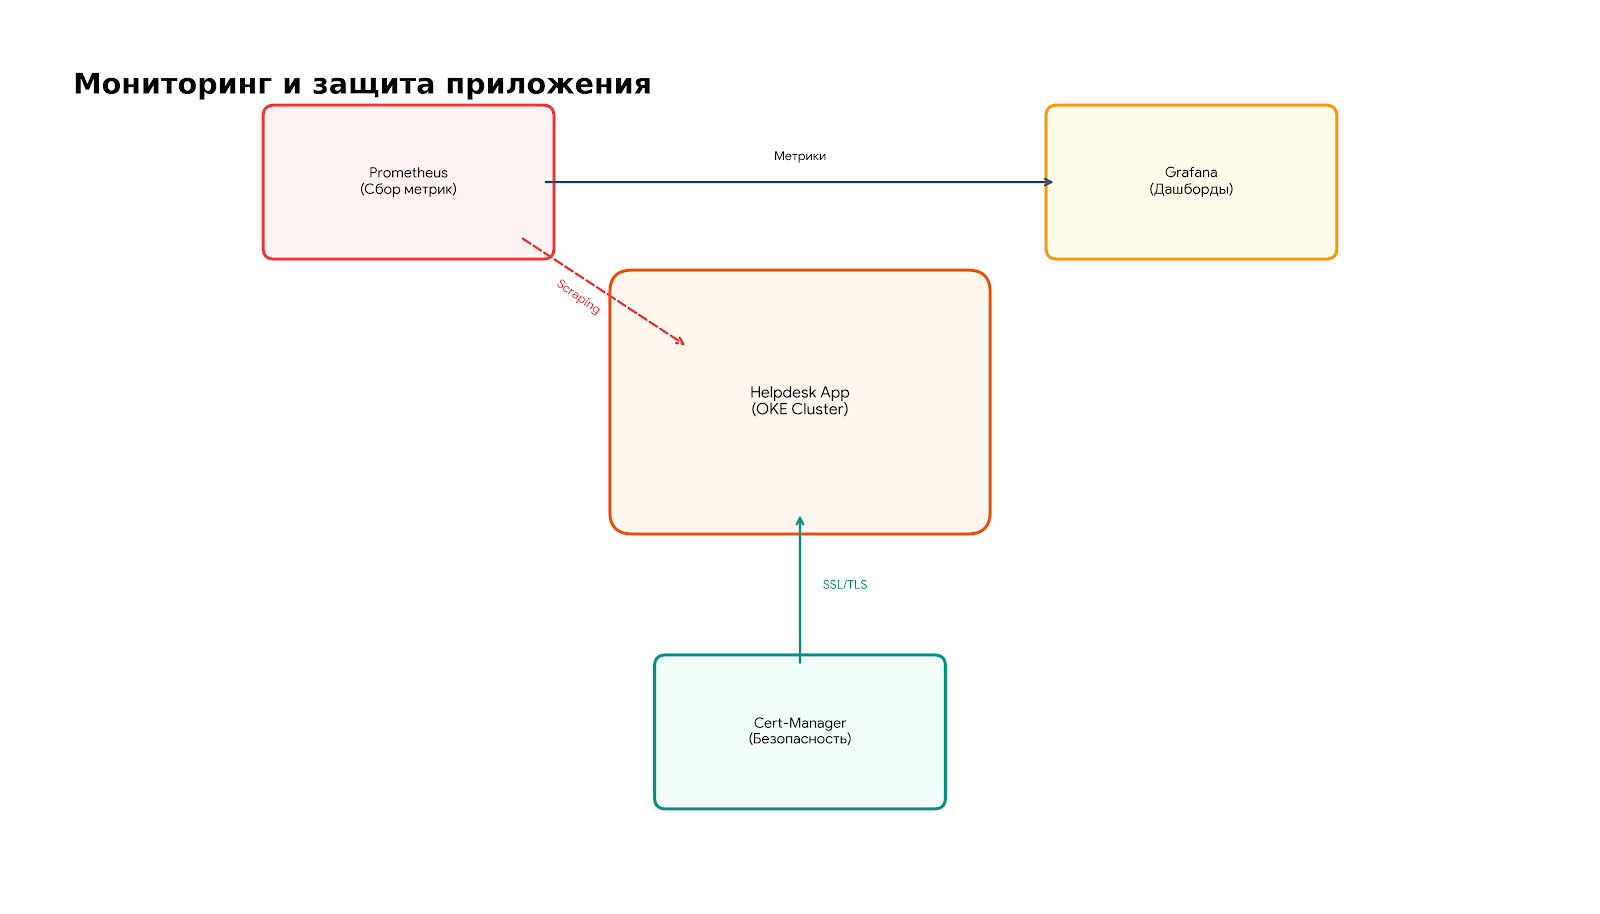
Key Components:
- Prometheus (Metrics Collection): Automatically scrapes application pods and cluster components. Collects data on CPU load, memory usage, and the number of HTTP requests.
- Grafana (Visualization): Connects to Prometheus as a data source. It is configured with dashboards that show the "health" of the Helpdesk in real-time.
- Cert-Manager (Security): Automates the acquisition and renewal of SSL certificates from Let's Encrypt. Ensures the application operates over a secure HTTPS protocol.